As a DevOps guy I often do incident analysis, post deployment
monitoring and usual logs checks. If you also is using Splunk as me
when let me show for you few effective Splunk commands for Nginx logs
monitoring.
Extract fileds
To make commands works Nginx log fields have to be extracted into variables.
Where are 2 ways to extract fields:
Where are 2 ways to extract fields:
- By default Splunk recognise “access_combined” log format which is default format for Nginx. If it is your case congratulations nothing to do for you!
- For custom format of logs you will need to create regular expression. Splunk has built in user interface to extract fields or you can provide regular expression manually.

Website traffic over time and error rate
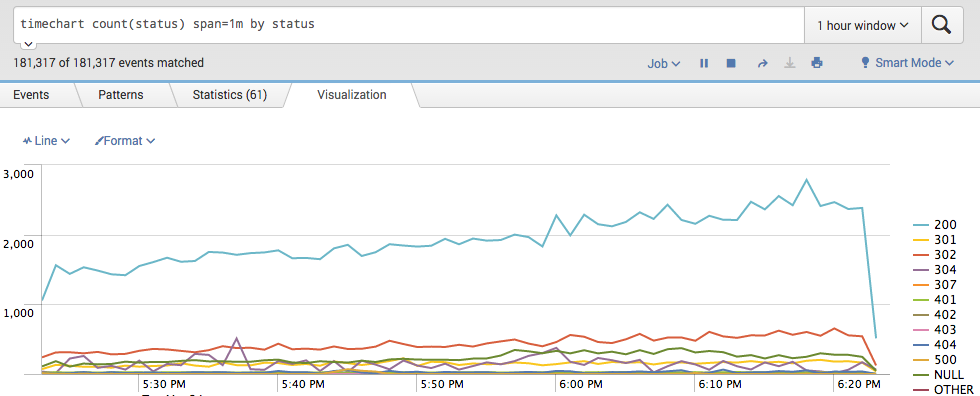
Unexpected spike in traffic or in error rate are always first thing
to look for. Following command build a time chart with response codes.
Codes 200/300 is your normal traffic and 400/500 is errors.

Response time
How do you know if your website running slowly?
For response time I suggest to use 20, 85 and 95 percentile as metrics.
You also can think of average response time metric, but low average response time doesn’t show that website is OK, so I am not using that metric in the query.
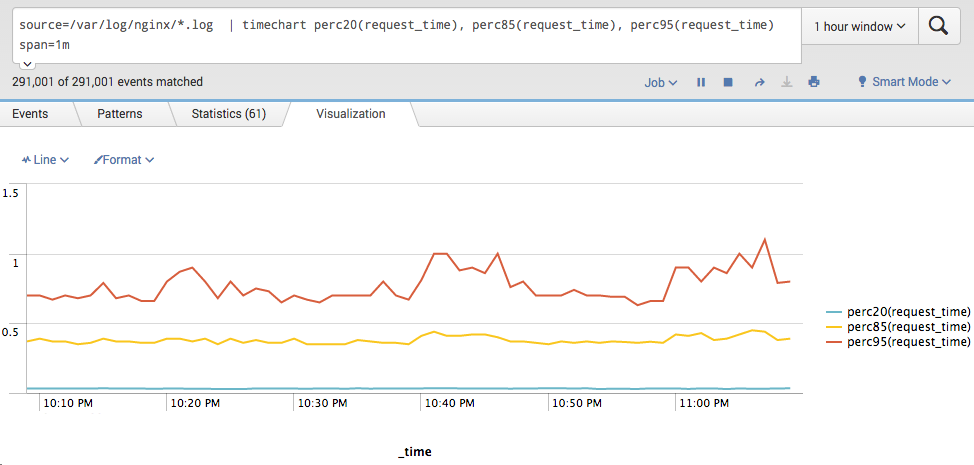
For response time I suggest to use 20, 85 and 95 percentile as metrics.
You also can think of average response time metric, but low average response time doesn’t show that website is OK, so I am not using that metric in the query.

Traffic by IP
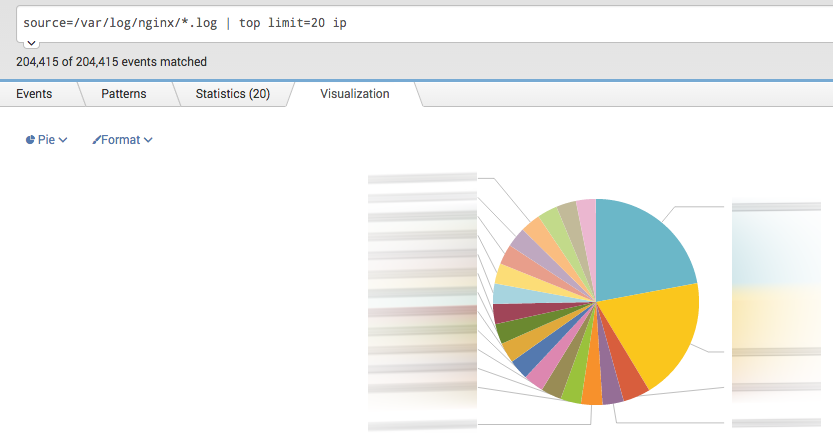
Checking which IPs are most popular is a good way to spot bad guys or misbehaving bot.

Top of error page
Looking for pages which produce most errors like 500 Internal
Server Error or not found pages like 404? Following two queries give you
exactly that information.
Top error pages
Top 40x error pages

Top error pages
Top 40x error pages

Number of timeouts(>30s) per upstream
When you are using Nginx as a proxy server it is very useful to see if any of upstreams are getting timeouts.
Timeouts could be a symptom for: slow application performance, not enough system resources or just upstream server is down.
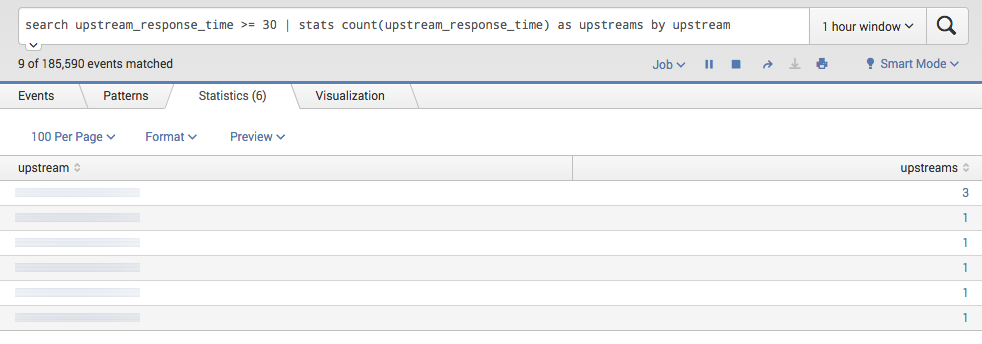
Timeouts could be a symptom for: slow application performance, not enough system resources or just upstream server is down.

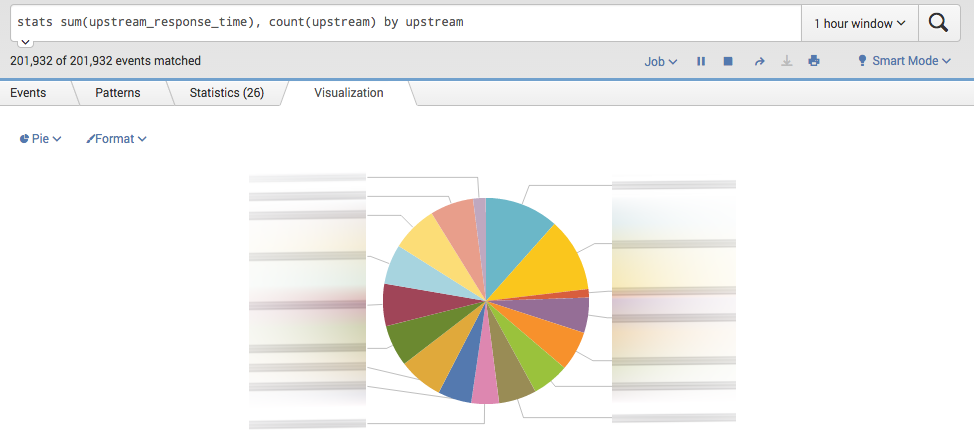
Most time consuming upstreams
Most time consuming upstreams showing which of servers are already
overloaded by requests and giving you a hint when application needs to
be scaled

Không có nhận xét nào:
Đăng nhận xét